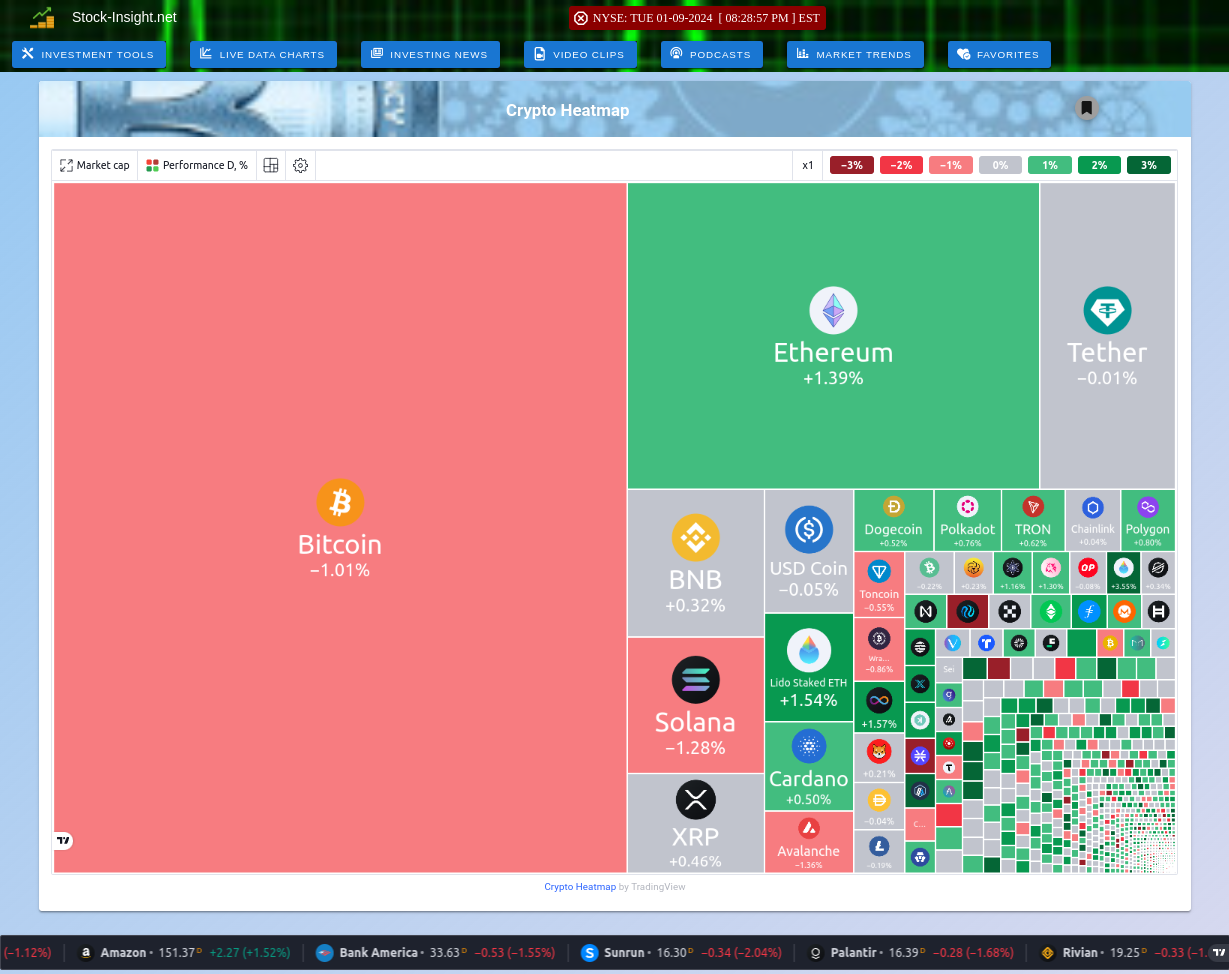
Interactive Crypto Market Heatmap From TradingView
View Live Crypto Market Coins by Market Cap, Percentages, & Active Daily Volume
Live Crypto HeatMap from TradingView serves several important functions for traders and investors in the cryptocurrency market.
TradingView's Crypto Heat Map is a powerful tool that helps users track market dynamics, compare cryptocurrency performances, and make informed trading decisions based on real-time data.
- Market Overview:
It provides a comprehensive view of the cryptocurrency market by displaying various cryptocurrencies along with their market capitalization, price movements, and trading volumes. This allows users to quickly assess the overall market landscape and identify trends
- Performance Comparison:
The heat map enables users to make precise comparisons between different cryptocurrencies, helping them to see how the price performances of various coins stack up against each other. This feature is particularly useful for evaluating potential investment opportunities
- Real-Time Insights:
The heat map offers real-time data visualization, which is crucial for short-term traders looking for quick profit opportunities. By highlighting significant price movements, it helps traders make informed decisions based on current market conditions
- Visual Representation:
The color-coded cells in the heat map provide an intuitive way to visualize the performance of cryptocurrencies. This visual representation makes it easier for users to spot which coins are performing well and which are underperforming at a glance
